Analytics
The platform analytics is available under the first tab on the right side in admin section here: Video engagement & insight report - OTT Stream
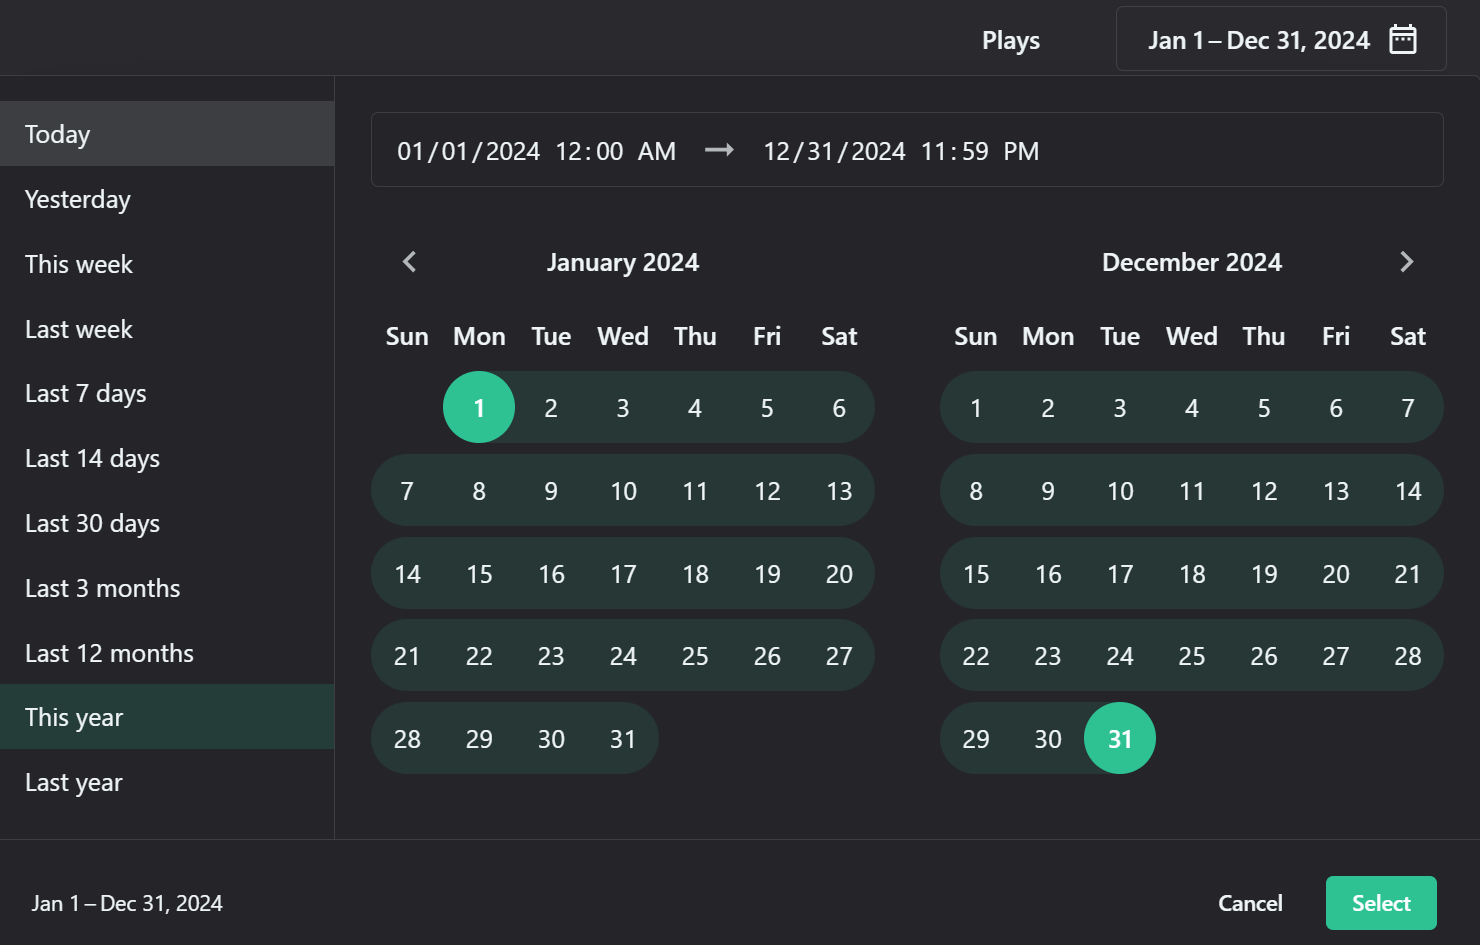
It analyses the number of plays for a specific time period.
It displays view data on new users, titles, ratings, video plays, and comments

It displays view data on new users, titles, ratings, video plays, and comments
Additionally, it provides graphical representations of:
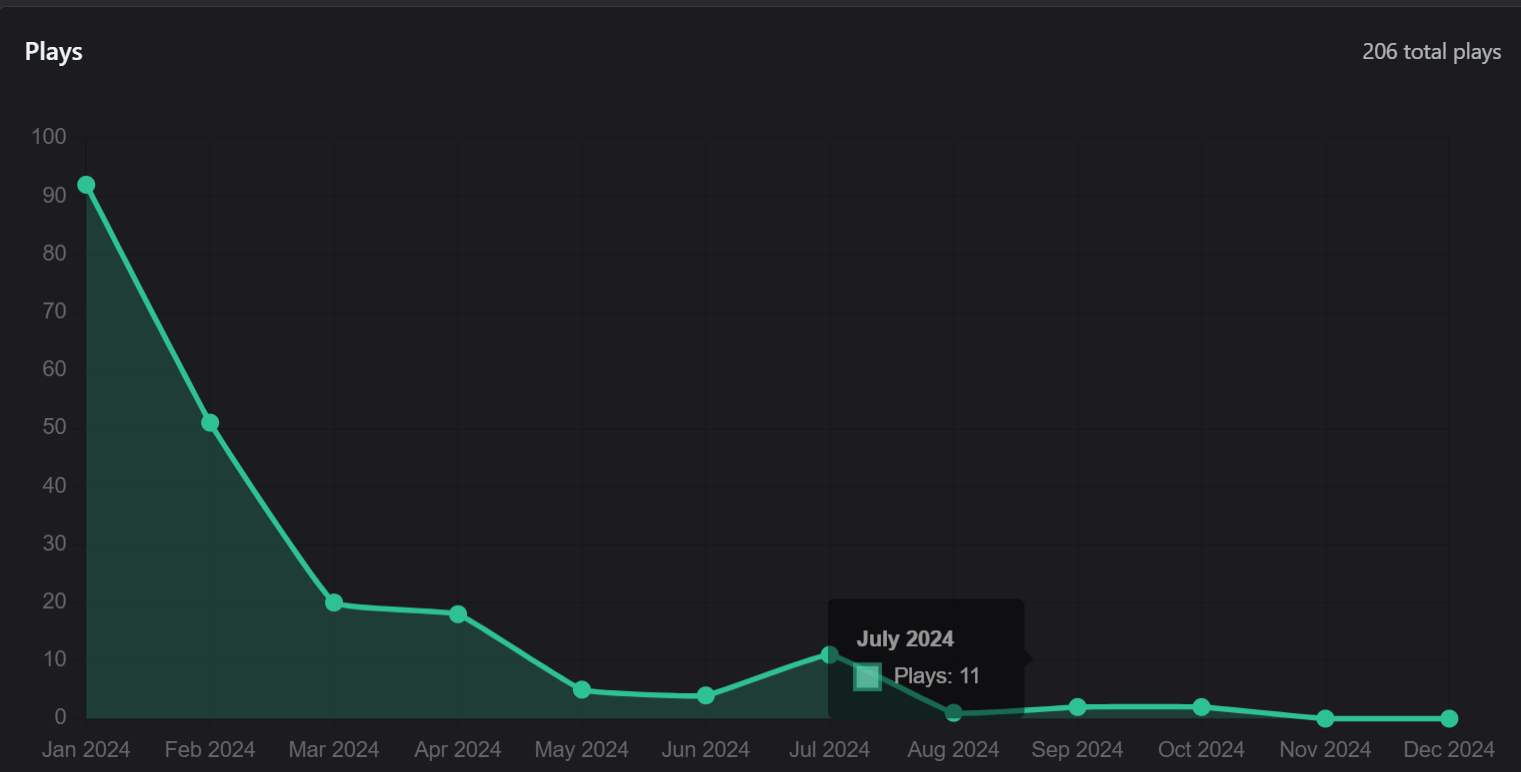
o Number of plays - a metric that helps identify popular content:
o Top devices: information to guide device-specific optimizations.
o Most played series, movies, and videos: data that can inform content acquisition and promotion strategies
o Top users: Identifying power users can inform loyalty programs or beta testing groups.
o Top locations: This geographic data can help with content localization efforts. Consider visualizing this data on a map for easier interpretation.
o Top platforms: This can inform platform-specific optimizations.
Related Articles
Set up Google Analytics on OTT Stream
To configure Google Analytics., navigate Admin Area > Settings > Analytics to add your Google Analytics ID and Google Analytics Tracking Code. Once linked, OTT Stream will provide traffic data to your related Google Analytics account. Analytics ...Does the OTT CMS provide analytics?
The system is equipped with a simple analytics tool to track some basic data such as the number of movies, TV shows, and live channels has been uploaded, the number of current subscribers, the number of transactions you have for the past day, week, ...Introduction
Welcome to the user manual for the OTT (Over-The-Top) Content Management System (CMS) platform, powered by PlayBox Technology. This comprehensive guide will walk you through the setup, configuration, and management of your OTT CMS, enabling you to ...Mail settings
When configuring the mail settings, you can change incoming and outgoing email handlers, email credentials and other related settings. The section is located here: Settings - OTT Stream The mail settings: - Define the outgoing email address and ...Landing Page
The landing page of your OTT platform is crucial for user engagement and content discovery. It's designed to be dynamic, visually appealing, and highly customizable to meet your specific content strategy and user preferences. The landing page ...